
The Rich Do, in Fact, Pay Higher Tax Rates
Here's why.
Key point: Claims that the rich pay less are based on faulty data.
An article in the New York Times the other day was titled “The Rich Really Do Pay Lower Taxes Than You,” and one in Bloomberg was subtitled “The Wealthiest 400 Americans Have the Lowest Rates.”
It is not true.
Both articles were prompted by the release of figures from economists Emmanuel Saez and Gabriel Zucman, which in turn builds on work with their colleague Thomas Piketty. Despite garnering vast media coverage for their estimates of income, wealth, and tax distributions, this trio of economists (“PSZ”) have become known for publishing dubious data.
In a 2018 report, economist James K. Galbraith found that data on the trio’s “world inequality database” is “sparse, inconsistent, and unreliable” and “not very consistent with other reputable sources.” Furthermore, the data is based on assumptions that are “beyond heroic.”
Economist David Splinter has a new critique of the Saez and Zucman data behind the NYT and Bloomberg stories. He found that the authors made numerous flawed assumptions, which threw their estimates way off.
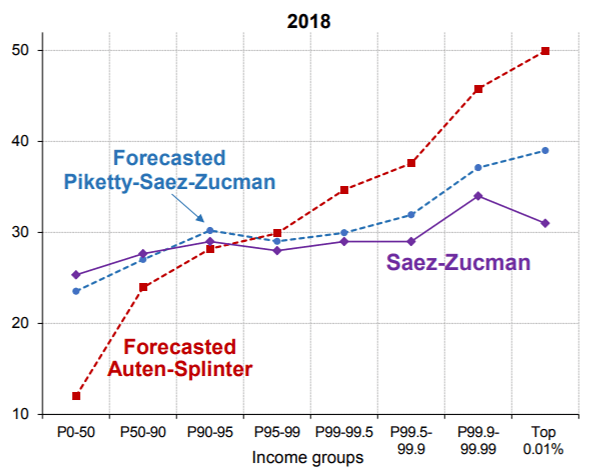
The figure below from Splinter shows estimates of average tax rates by income group for 2018, including federal, state, and local taxes. Average tax rates are taxes paid divided by income within each income group. The figure shows Splinter’s estimate with Gerald Auten (red line), the new Saez-Zucman estimate (purple line), and the PSZ estimate (blue line) on which it was partly based. The income groups along the horizontal axis are percentiles—for example, “P0-50” means the bottom 50 percent of taxpayers.
Auten and Splinter find that average U.S. tax rates are highly graduated, ranging from 12 percent for the bottom half of taxpayers to 50 percent for the top 0.01 percent of taxpayers. By contrast, Saez and Zucman claim that tax rates are similar across income groups at between 25 and 34 percent. In the figure, the red line is the accurate one in my opinion, while the blue and purple ones are not.
Splinter discusses the flaws in the Saez and Zucman data. One error is that they distribute the very large amount of income that is unreported on tax returns in a way that greatly inflates top-end income, which in turn substantially reduces estimated tax rates at the top. Splinter and Auten provide a detailed critique of PSZ estimation methods here.
The NYT got its headline from the Saez-Zucman tax rate estimate for the top 400 taxpayers, who are a subset of the top 0.01 percent. Without the 400, the NYT and Bloomberg would not have their incendiary headlines. Auten and Splinter do not estimate the top 400, but the Saez-Zucman tax rate for that group is still far above Auten and Splinter’s estimate for the bottom group.
Also, as Splinter notes, the estimates shown in the figure do not include the huge refundable portion of tax credits, which would further push down average tax rates at the bottom end.
In conclusion, reporters and columnists should be much more skeptical of Piketty, Saez, and Zucman data. Economists make many assumptions when preparing estimates, and the trio always seem to choose the assumptions that inflate their figures for income and wealth inequality while underestimating top-end tax rates.
A 2017 Cato book discusses Piketty’s data follies, and this recent study examines how PSZ inflate their U.S. wealth inequality estimates.
Further notes on the top 400 are here and here.
This article by Chris Edwards originally appeared in the CATO at Liberty blog in 2019.
Image: Reuters